top of page
Top
Dataset 4: IMG_1053.MOV
Semi-minor axis (b)
Eccentricity (e)
Time Period (T)
6.1954067 cm
0.4967601
5.4775393 cm
0.8890453 s
0.4672427
Angular Momentum (h)
fig 5A
Animation of marble motion
Fig 5B
Path traced by marble
Reduced mass (u)
239.83381
11877.352

fig 5C
3D points in space

Distribution of angles of deviation from best fitted plane
fig 6
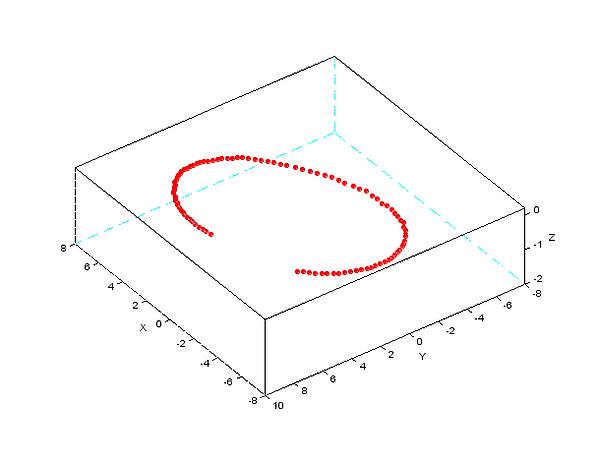
fig 6B
Normal vectors of planes containing consecutive points

fig 7
Best fitted plane and distribution of data points about it
fig 8B
3D data, projected data and best fitted plane
fig 9
3D and projected data on the surface
fig 10

Ellipse fitted to projected data
fig 11B
Ellipse parameters

LRL vector
fig 12B

Equal area sectors
fig 13


bottom of page